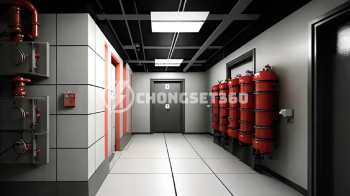
Hệ thống phòng cháy chữa cháy (PCCC) là yếu tố thiết yếu trong việc bảo vệ tính mạng, tài sản và môi trường trong các công trình xây dựng. Thi công hệ thống PCCC đảm bảo ...


Chúng tôi cam kết mang tới cho khách hàng dịch vụ tốt nhất
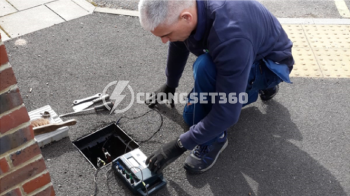
Với đội ngũ kỹ sư, nhân công giàu kinh nghiệm, chúng tôi luôn cam kết mang tới cho khách hàng những giải pháp tối ưu nhất, với công nghệ mới và chất lượng tốt nhất


Chúng tôi luôn cam kết dịch vụ và hiệu quả thi công tốt nhất. Chất lượng sản phẩm và uy tín là ưu tiên hàng đầu chúng tôi cam kết mang tới cho khách hàng.

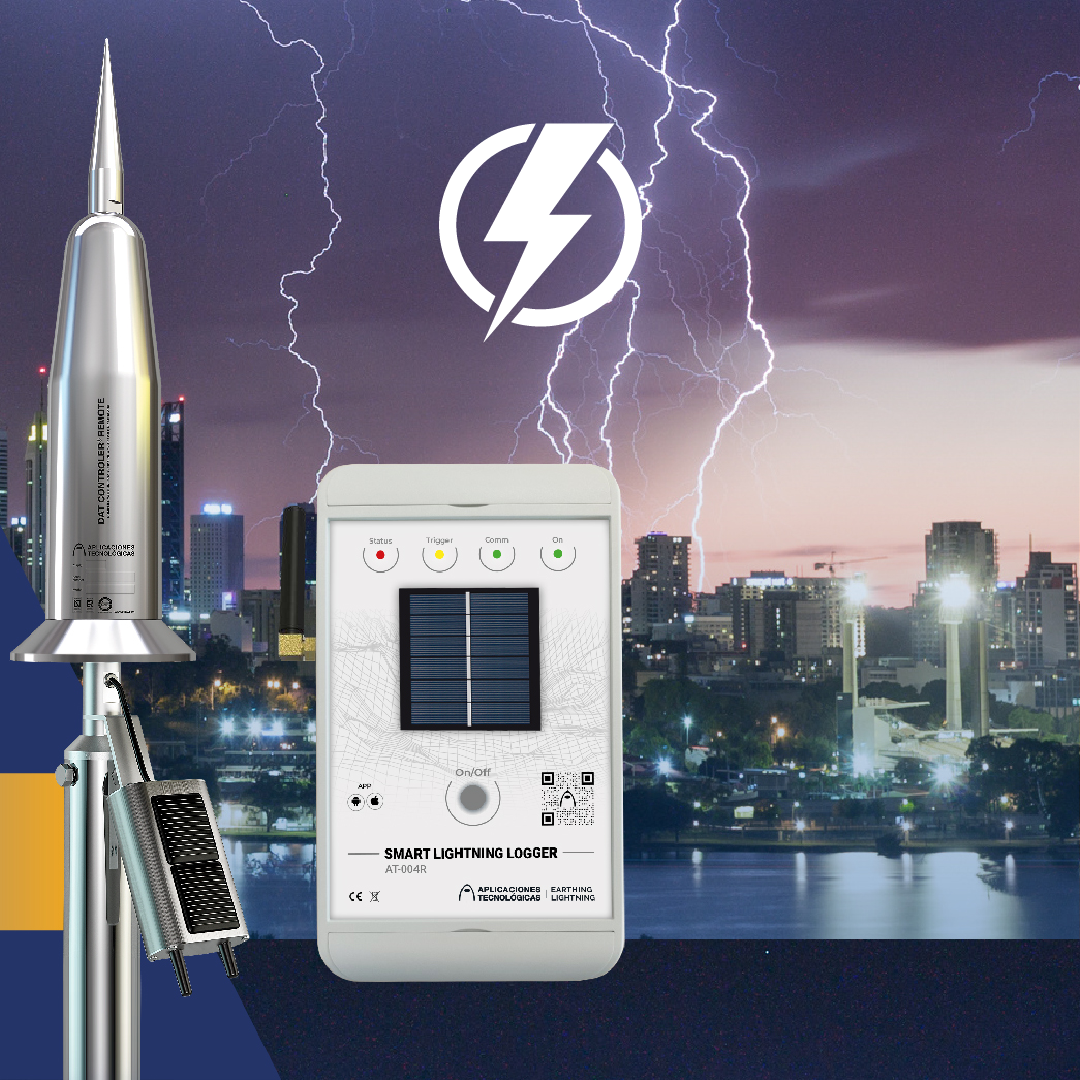
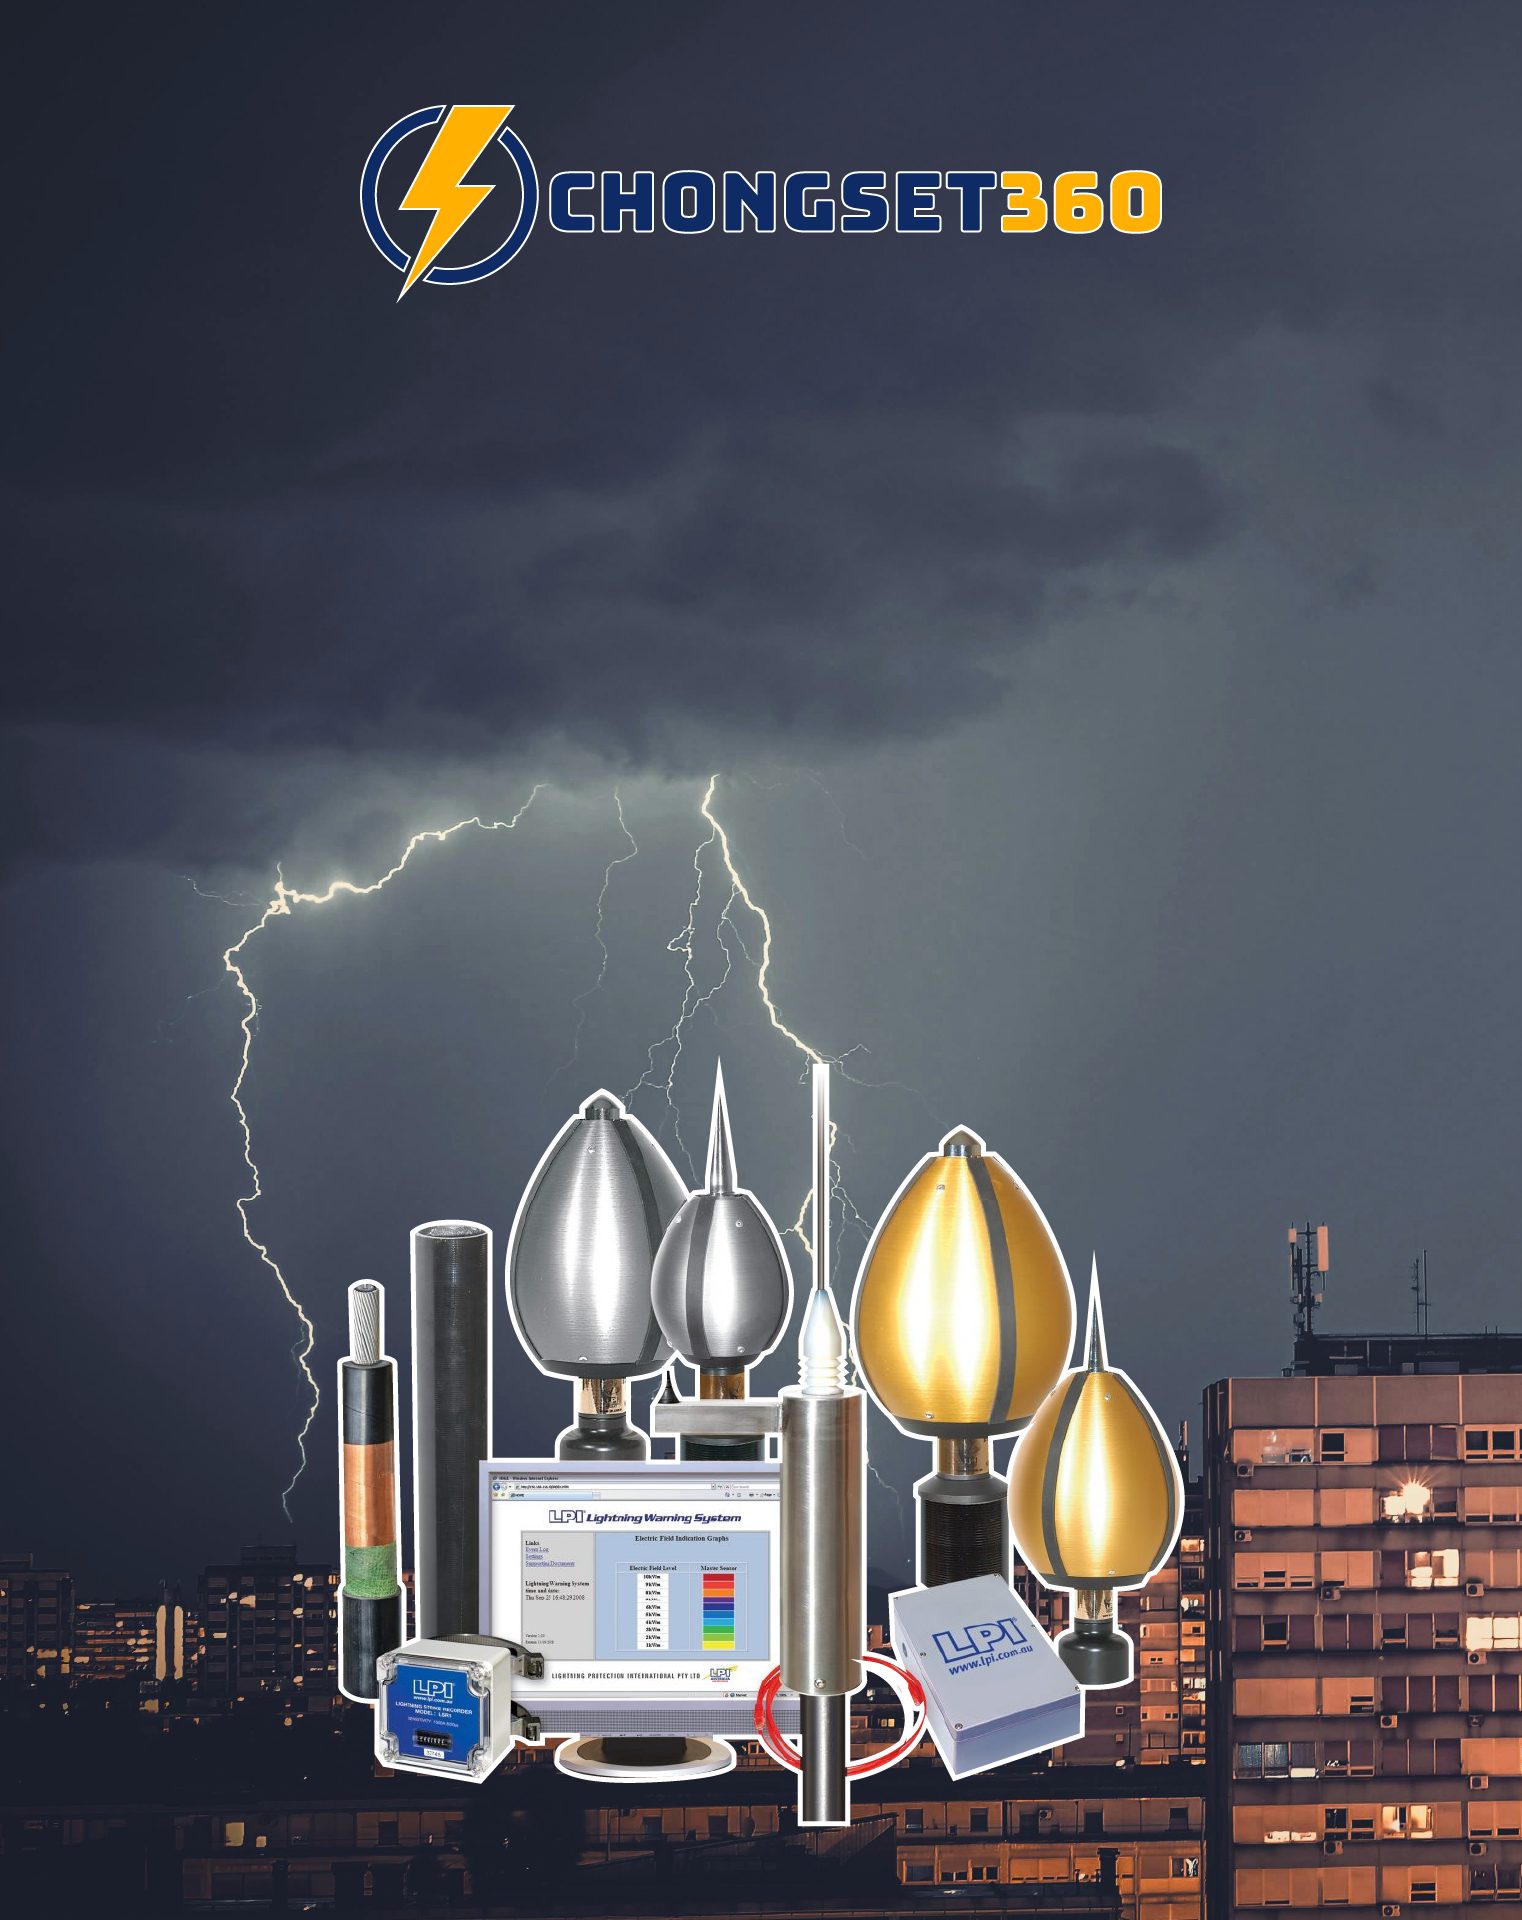
Chúng tôi đang từng bước thực hiện mục tiêu trở thành một trong những đơn vị hàng đầu trong lĩnh vực cung cấp giải pháp. tư vấn, thiết kế & thi công thiết bị chống sét

Sứ mệnh của chúng tôi là đem lại những giải pháp và dịch vụ tốt nhất, chất lượng sản phẩm và uy tín thương hiệu là ưu tiên hàng đầu chúng tôi cam kết mang tới cho khách hàng.

Với đội ngũ kỹ sư, nhân công giàu kinh nghiệm, chúng tôi luôn cam kết mang tới cho khách hàng những giải pháp tối ưu nhất, với công nghệ mới và chất lượng tốt nhất